ANNUAL FUEL COST / USAGE
- GOAL:
- Students will become wiser energy consumers by becoming aware of the relative energy used by the various vehicles.
- OBJECTIVE:
- The student will become more familiar with the United States Department of Energy's EPA Fuel Economy Estimates and be able to:
- 1. Interpret the various fuel usage and costs.
- 2. Differentiate MPG for cars and light trucks of the same size and class.
- 3. Calculate estimated annual fuel costs for any vehicle.
- LESSON/INFORMATION:
- Each year, the United States Department of Energy publishes an annual Gas Mileage Guide. This guide is very helpful to consumers in determining the estimated annual fuel costs to operate a vehicle.
- There are three broad classifications of vehicles -- Cars, Light Trucks, and Special Purpose Vehicles. Cars are further classified as either a Sedan, Two Seater, or Station Wagon. Each of these car subclassifications are also subdivided according to the vehicles's interior volume. Trucks are classified as a Van, Small Pickup, or Large Pickup. The vehicle's GVW (Gross Vehicle Weight) is used for this rating. Special Purpose Vehicles are light vehicles not in any Car or Truck class. Cab and Chassis Trucks are included with the Special Purpose Vehicles. See the following list for the classifications.
-
-
Vehicle Classes
- CARS
- Sedans
- Minicompact
- Subcompact
- Compact
- Mid-Size
- Large
- Two-Seaters
- Station Wagons
- Small
- Mid-Size
- Large
- TRUCKS
- Vans
- Passanger
- Cargo
- Small Pickups
- 2-Wheel
- 4-Wheel
- Large Pickups
- 2-Wheel
- 4-Wheel
- SPECIAL PURPOSE VEHICLES
- 2-Wheel
- 4-Wheel
- Cab Chassis
- Each new vehicle must have an appropriate Fuel Economy Label affixed to one window. There are five important areas to examine so that this label is understood. See Figure 2 for a sample Fuel Economy Label.
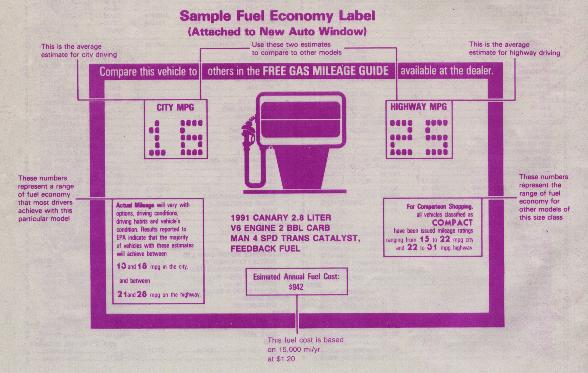
- Figure 2 (Scan from DOE/CE-0019/10)
- Figure 2A focuses on the vehicle data. This portion of the label describes the vehicle which is being rated. This includes the vehicle Model, engine size, description of the type of fuel delivery system (carburetted or fuel injected), type of transmission, and major emissions control devices.

- Figure 2A
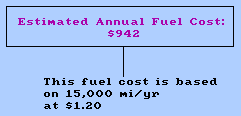
- Figure 2B gives the estimated annual fuel cost. This cost is based on driving this vehicle 15,000 miles at some standard fuel cost. For the 1991 year model vehicles, a per gallon cost of $1.05 for diesel, $1.10 for regular unleaded gasoline, and $1.30 for premium unleaded gasoline was used.
- Figure 2B
- Figure 2C gives the comparison data for similarly classified vehicles. This section shows the highest and lowest MPG for city and highway for ALL vehicles in the class.

- Figure 2C
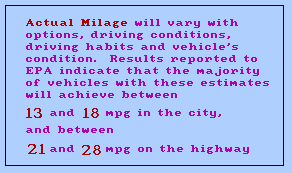
- Figure 2D gives the city and highway usage MPG ranges for that particular vehicle. Note that this a mileage range -- a high and low for city and highway driving.
- Figure 2D
- Figure 2E

- Figures 2E and 2F represent the respective AVERAGE city and highway MPG for that vehicle.

- Figure 2F
- The DOE Guide supplies specific information for each vehicle sold in the United States. Figure 3 displays the information given on each vehicle.
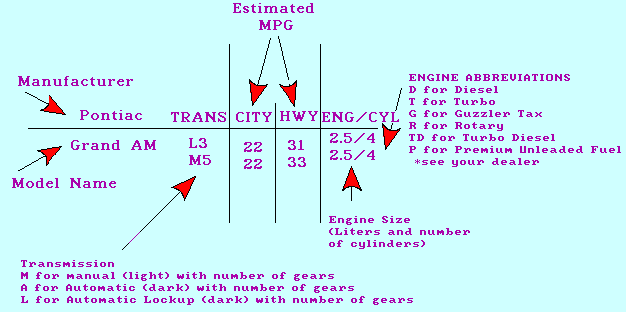
- Figure 3
- This information is arranged by size classification to facilitate easier comparisons. Figure 4 is a chart giving the annual fuel costs rates for various MPG and various cost fuels.
-
Figure 4
|
ANNUAL FUEL COSTS CHART
For 1991 Model Year
Based 0n 15,000 Miles per Year |
Est
MPG |
Dollars Per Gallon
|
| 1.90 |
1.70 |
1.50 |
1.30 |
1.10 |
1.05 |
| 50 |
570 |
510 |
450 |
390 |
330 |
315 |
| 49 |
582 |
520 |
459 |
398 |
337 |
321 |
| 48 |
594 |
531 |
469 |
406 |
344 |
328 |
| 47 |
606 |
543 |
479 |
415 |
351 |
335 |
| 46 |
620 |
554 |
489 |
424 |
359 |
342 |
| 45 |
633 |
567 |
500 |
433 |
367 |
350 |
| 44 |
648 |
580 |
511 |
443 |
375 |
358 |
| 43 |
663 |
593 |
523 |
453 |
384 |
366 |
| 42 |
679 |
607 |
536 |
464 |
393 |
375 |
| 41 |
695 |
622 |
549 |
476 |
402 |
384 |
| 40 |
713 |
638 |
563 |
488 |
413 |
394 |
| 39 |
731 |
654 |
577 |
500 |
423 |
404 |
| 38 |
750 |
671 |
592 |
513 |
434 |
414 |
| 37 |
770 |
689 |
608 |
527 |
446 |
426 |
| 36 |
792 |
708 |
625 |
542 |
458 |
438 |
| 35 |
814 |
729 |
643 |
557 |
471 |
450 |
| 34 |
838 |
750 |
662 |
574 |
485 |
463 |
| 33 |
864 |
773 |
682 |
591 |
500 |
477 |
| 32 |
891 |
797 |
703 |
609 |
516 |
492 |
| 31 |
919 |
823 |
726 |
629 |
532 |
508 |
| 30 |
950 |
850 |
750 |
650 |
550 |
525 |
| 29 |
983 |
879 |
776 |
672 |
569 |
543 |
| 28 |
1018 |
911 |
804 |
696 |
589 |
563 |
| 27 |
1056 |
944 |
833 |
722 |
611 |
583 |
| 26 |
1096 |
981 |
865 |
750 |
635 |
606 |
| 25 |
1140 |
1020 |
900 |
780 |
660 |
630 |
| 24 |
1188 |
1063 |
938 |
813 |
688 |
656 |
| 23 |
1239 |
1109 |
978 |
848 |
717 |
685 |
| 22 |
1295 |
1159 |
1023 |
886 |
750 |
716 |
| 21 |
1357 |
1214 |
1071 |
929 |
786 |
750 |
| 20 |
1425 |
1275 |
1125 |
975 |
825 |
788 |
| 19 |
1500 |
1342 |
1184 |
1026 |
868 |
829 |
| 18 |
1583 |
1417 |
1250 |
1083 |
917 |
875 |
| 17 |
1676 |
1500 |
1324 |
1147 |
971 |
926 |
| 16 |
1781 |
1594 |
1406 |
1219 |
1031 |
984 |
| 15 |
1900 |
1700 |
1500 |
1300 |
1100 |
1050 |
| 14 |
2036 |
1821 |
1607 |
1393 |
1179 |
1125 |
| 13 |
2192 |
1962 |
1731 |
1500 |
1269 |
1212 |
| 12 |
2375 |
2125 |
1875 |
1625 |
1375 |
1313 |
| 11 |
2591 |
2318 |
2045 |
1773 |
1500 |
1432 |
| 10 |
2850 |
2550 |
2250 |
1950 |
1650 |
1575 |
| 9 |
3167 |
2833 |
2500 |
2167 |
1833 |
1750 |
- For those who purchase fuel by the liter, 3.785 liters equals one gallon.
- These dollar amounts are based on 15,000 miles of driving. Consumers are able to achieve a closer annual estimate by using the estimated city and highway MPG values and applying their percentage mix of city and highway driving and multiplying the cost by that percentage. For example, suppose someone drove 40 percent of the time in the city and 60 percent on the highway and was considering purchasing a vehicle which delivered an average of 18 MPG city and 30 MPG highway. Assume $1.50 per gallon. Using the chart, the city operational cost for 15,000 annual miles is $1,250; the highway is $750. Calculate the estimate annual cost as follows:
- CITY:
- $1,250.00 x 40% = $500.00
- HIGHWAY:
- $750.00 x 60 % = $450.00
- Net Estimated Cost:
- $500.00 +$450.00 = $950.00
- ACTIVITY:
- 1. Obtain a copy of the current DOE Gas Milage Guide.
- 2. Select a class of vehicle.
- 3. Select three of your favorite brand vehicles from that class.
- 4. Using the government data sheets, determine the MPG and number of gallons for 15,000 miles for each of these vehicles.
- 5. If fuel costs $1.50 per gallon, using these charts, determine the relative annual fuel cost for each vehicle. Assume that each vehicle is driven 35 percent in city and 65 percent on the highway.
- 6. Calculate the cost of operation for each of these three vehicles if the city and highway driving mix were 70 percent city and 30 percent highway.
- CONCLUSION:
- Write a short paragraph comparing the cost of operation and gallons of fuel saved annually by selecting different vehicles. Include a statement of how the city and highway can affect annual operating costs.
- Information Check
- Pace a "T" before the statements that are true and an "F" before the statements that are false. After each false statement, explain why it is false.
- _______1. All light trucks are placed in the same vehicle class.
- _______2. Federal regulations require that an MPG sticker be placed on each new vehicle.
- _______3. The estimated annual fuel costs is calculated on a 10,000 mile annual driving basis.
- _______4. Light trucks are classified by the vehicle's GVW.
- _______5. Transmissions are not a factor in determining DOE estimated MPGs.
- _______6. Diesel powered vehicles are not required to have a DOE MPG rating.
- _______7. The posted window sticker city and highway MPG rating is that vehicle's estimated average city and highway MPG.
- Teacher's Notes
- The purpose of this activity is to make the students aware of this valuable consumer information published each year by the DOE. Although students may not be in the new vehicle market today, at some time in the future, they will be. Many consumers are not aware of a vehicle's annual fuel cost. Most think that a one or two MPG difference can not make any significant difference in the total fuel costs. Another important point to be realized is the effect that the city and high driving mix has on MPG. This activity should assist students in understanding how vehicle selection and vehicle operation can alter operational fuel costs. It is through lowering these fuel costs that energy will be saved.
- ANSWERS TO INFORMATION CHECK QUESTIONS:
- 1. False. Light trucks are classified by GVW; light truck Cab and Chassis vehicles are classified as Special Purpose Vehicles.
- 3. False. Estimated annual fuel cost is based on driving 15,000 annual miles.
- 5. False. Transmissions are a factor in MPG. They are a part of the rating system.
- 6. False. All passenger cars and light trucks are rated; diesels are included in these ratings.
- Recommended Reading:
- Lockhart, Robert with Ken Bossong and Jonathan Becker, David Trickett, Daniel Yoon. Driving Up the Heat. Public Citizen Critical Mass Project. Washington D.C. 1991.
- 1991 Gas Mileage Guide, United States Department of Energy. DOE/CE-0019/10. U.S. Government Printing Office: 1990
- Energy Conservation Information for Vehicle Owners, United States Department of Energy. DOE/CE-0297P. U.S. Government Printing Office: 1991-289-606.
Comments or questions to: TechAsmt@LA.GOV
Return to Transportation Menu


